
01.09.2010: I am still abroad on a business trip, so no progress with flight testing. I will however return on the 4th, after which I will resume the tests.
06.09.2010: Finally I am back and ready to resume test flying. Today I did the test flight to determine vx and vy. To do that I had to climb eight times with full power from a low starting altitude (2500ft, lower is not possible where I live without flying lower than legally permitted) at different speeds (from 50 kts to 75 kts in steps of 5 kts), and each time for nine minutes. That took about two hours, luckily I had my daughter with me who did all the writing. This was so far the longest flight with my SportCruiser.
The average climb rate over the whole climb at the best speed was about 550 ft/min, but that’s at the maximum takeoff weight of 630 kg (I added some weight into the wing lockers). Above 7000 ft I still had around 450 ft/min climb rate
The total flying hours are now:
| Flight | Flight duration | Landings | Remarks |
| 8 | 2:01 | 1 | EAS test flight 2 |
| Total | 5:57 | 9 |
07.09.2010: Today I went for a check flight with Rolf, my co-builder. It was his first flight in our SportCruiser, and he loved it. I have to wait to get the Vx and Vy confirmed by the EAS engineer before I can continue with the regular flight tests, so we went on checking some of the systems. Today we verified that the VOR section of the Garmin GNS430 works, and it does. We also did some tests with the autopilot, but I need to do some configuration first as the response to correct the heading is too slow.
The total flying hours are now:
| Flight | Flight duration | Landings | Remarks |
| 9 | 0:37 | 1 | |
| Total | 6:34 | 10 |
I received the results of my test flight to determine Vx and Vy tonight. The result of the analysis done by the chief analytical engineer of the EAS looks as follows:
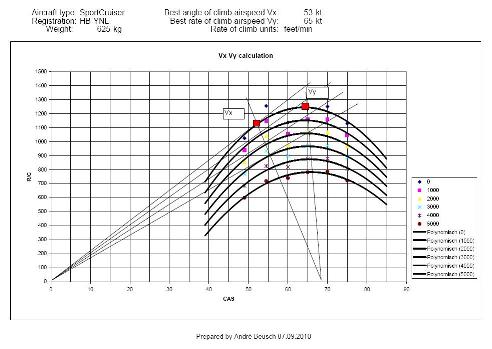
The graph shows the climb rate at MTOW for different altitudes, as well as the two speeds. Vx is 53 knots, Vy is 65 knots. At sea level and ISA conditions I would get 1250 ft/min climb rate, at a more realistic altitude of 2000 ft I should still achieve a bit more than 1000 ft/min. That’s not bad considering that I only have a ground adjustable propeller, and that I have set the pitch for a good cruise performance.
08.09.2010: This morning I helped Silvan find an error in the electrical system of the Dutch registered SportCruiser on which he performs maintenance (I am an electrical engineer). The owner noticed spurious fluctuations in both oil pressure and oil temperature readings, and also unstable values on many other engine parameters. He thought the Dynon EMS might have a problem, but my suspicion was more towards a problem with engine ground. The engine always ran smoothly, an while jumps in oil pressure might at least theoretically be possible, jumping temperature values are definitely not. When checking the sensor signals with an oscilloscope I noticed quite some electrical noise on them, but a soon as I connected the sensor casing to ground (e.g the firewall) the noise disappeared. When connecting sensor ground to battery (-), however, it did not disappear. Next I connected the battery (-) to the firewall, and even though there should be such a connection already, that made the noise disappear. When checking the existing connection, which goes from the battery (-) to a ring terminal that is held to the firewall by the screw that also holds the starter relay I noticed that the screw was just slightly loose. Tightening it made the problem disappear instantaneously.
Conclusion: Whenever there is a problem with engine parameter readings on the Dynon EMS make sure that there is a proper connection between the engine and the firewall. The starter ground cable is not sufficient, as it only goes to the battery (-).
09.09.2010: Today the flight test to determine the climb rate and to verify that the engine cooling system is providing sufficient performance was on the agenda. To do that one has to climb for 15 minutes with full power at Vy (verified during the previous flight), and to write down every minute the altitude, outside air temperature, RPM and oil and water/cylinder head temperatures.
In the morning I also managed to make the transponder work (Mode-S, Garmin GTX 330). I checked the altitude encoder the evening before at home and noticed that it was faulty. Luckily we have the avionics company Kuerzi next door (where I bought all the avionics), so I could just go over to fetch a replacement, and the new one worked immediately. Only 15 minutes later the transponder ground test was done (great service), so I also put a verification with ATC onto the list of test flight objectives.
My wife volunteered again to be the flight test engineer, so off we went. The transponder worked as expected, ATC could not only see me on the radar but also all the data that a Mode-S transponder transmits. Some people don’t like it that ATC can see your call sign, but I prefer to be seen with my call sign on radars or collision avoidance systems if I ever accidentally enter controlled airspace, rather than being sucked in to the fan of a big jet engine of an airliner.
Next we did the actual climb test. The instructions say that one should start as low as practically possible, but we can’t do flight testing below 2500 ft around Lommis without hitting ground. I therefore had to expect a maximum altitude of more than 10’000 ft after 15 minutes of climb, even at max take off weight. I therefore decided to do the flight in a southern direction, which brought us into the alpine airspace where class C only starts at flight level 130. Above Lommis we have the TMA of Zurich down to 5’500 ft, but that limit gradually increases when heading south.
All engine parameters stayed well in the respective green ranges, with the oil reaching 105 degrees and the water 115 degrees. At around 7’500 feet it started snowing a bit, but luckily this was only a local phenomena that stopped a few hundred feet higher. In the end we reached around 10’500 ft, with a climb rate of still around 400 ft/min. And again, that was at 630 kg MTOW. I wonder what the maximum altitude will be.
In the afternoon I also did a short flight to set some of the parameters in the Dynon EFIS.
The total flying hours are now:
| Flight | Flight duration | Landings | Remarks |
| 10 | 1.10 | 1 | EAS test flight 3, Transponder check |
| 11 | 0:32 | 1 | Dynon configuration |
| Total | 8:16 | 12 |
12.09.2010: Nothing with flying today, I went hiking instead with my wife. We took the train to Zermatt and made a tour of a few hours with beautiful weather and views on the mountains, including of course the famous Matterhorn. That’s what I call postcard weather.

12.09.2010: Today I met Martin, my Flight Testing Advisor. He came from Langenthal, and of course in a homebuilt plane, a Brügger Cherry. As the weather was nearly as good as yesterday, everybody wanted to go flying. I have not seen the hangars so empty in a long time.
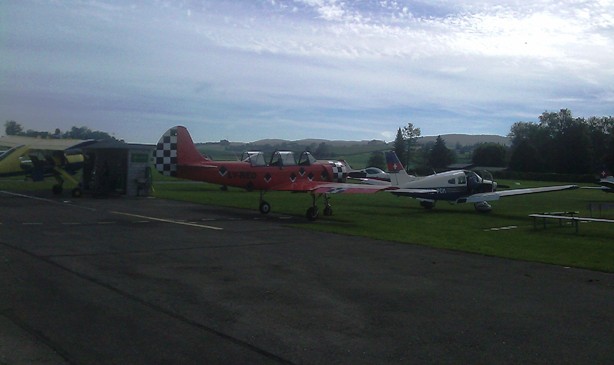
Lommis Airfield has restricted operating hours, especially on Sunday where the airport only opens at 11:00 and is closed from 12:00 to 13:30. Everybody therefore wanted to get out between 11 and 12. I wanted to do a quick flight with Martin before 12, so we had to squeeze in between the other departing planes. We actually had to queue behind several other planes for takeoff, definitely a rare event for Lommis.
After the flight I gave Martin an update on the progress of the flight testing and we discussed the next flights. I am still waiting for the results of the flight 3, next come the flights to determine stall speed and stall characteristics. I will do them with a flight instructor as passenger instead of a family member.
The total flying hours are now:
| Flight | Flight duration | Landings | Remarks |
| 12 | 0:15 | 1 | |
| Total | 8:31 | 13 |
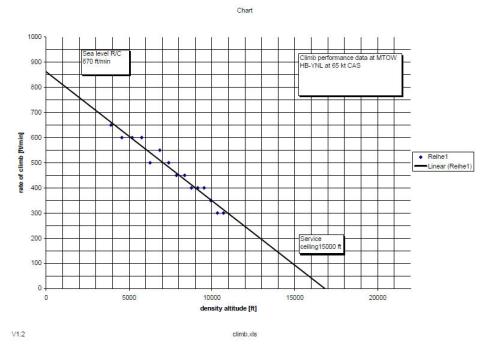
14.09.2010: No flying today, but I received the results of my climb rate / engine cooling test. They say that at the MTOW of 630 kg and under ISA conditions at sea level the SportCruiser has a climb rate of 870 ft/min. They graph also predicts a ceiling altitude of 15’000 ft (that’s the altitude where the climb rate drops to 100 ft/min), an again that’s at 630 kg MTOW. Flying alone I can probably reach the stratosphere.
15.09.2010: Today verifying the stall speed and stall characteristic for different configurations and power settings was on the agenda. To make sure nothing goes wrong I first replaced the lead weights I have been using to increase the weight to MTOW with paper bundles of the same weight that properly fit into the wing lockers. As they nicely fit into the lockers they can’t move around even in case of an unintended spin.
Then I briefed Walter, my “flight engineer” for the flight, about the procedures to be flown. Walter is a flight instructor, an I considered it more prudent to take him along rather than somebody of my family.
The procedures to be flown were always the same:
- set the power for the respective case (full or idle)
- set the flaps for the respective case (0, takeoff or landing)
- fly either straight or a curve with 30 degrees bank
- reduce the speed until buffeting starts and then until stall occurs
- recover from the stall
Recorded are the speed where buffeting starts, the actual stall speed, the behaviour (wing drop, straight drop etc.), the angle of wing drop or nose drop, the maximum speed during recovery and the altitude loss. That gave quite a bit of writing to do for Walter.
As expected from my own experience flying the SportCruiser at Czech Aircraft Works in 2007, as well as from the discussions with the designer of the SportCruiser, the stall behaviour is extremely benign, with clear buffeting before the stall, a maximum wing drop of about 10 degrees during the stall (only in two configurations, 0 degrees in most), immediate recovery when the stick is relaxed forward even only for a small amount. Maximum loss of altitude is less than 100 ft during stall recovery, even if it is performed without adding power.
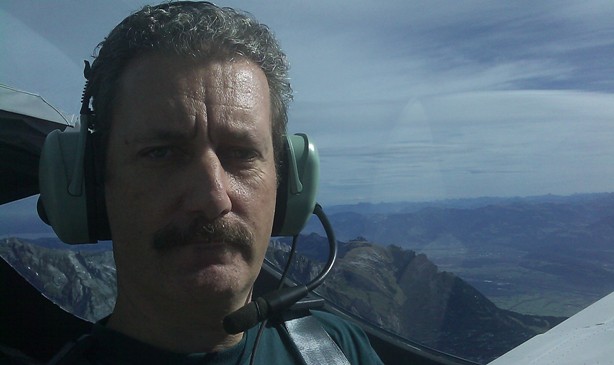
After the landing and debriefing I decided to add some more flying time to my SportCruiser, so I went alone towards the mountains. It is only about 15 minutes of flight from Lommis to the Säntis and the Churfirsten (seven peaks in a row), all of which are about 7’500 ft high. At around 6’000 ft I noticed that there must be quite some wind, as I had to fly a heading nearly 30 degrees off to where I wanted to go. Luckily the Dynon, if coupled to a GPS, provides wind speed and direction as a small arrow at the bottom of the HSI, and that indication was 46 kts! There was however very little turbulence.
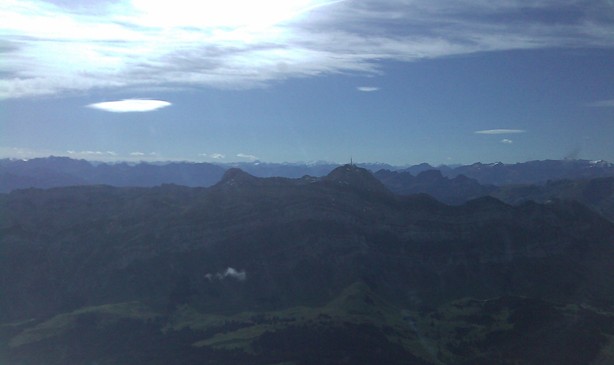
I just could not refrain from taking a self portrait…
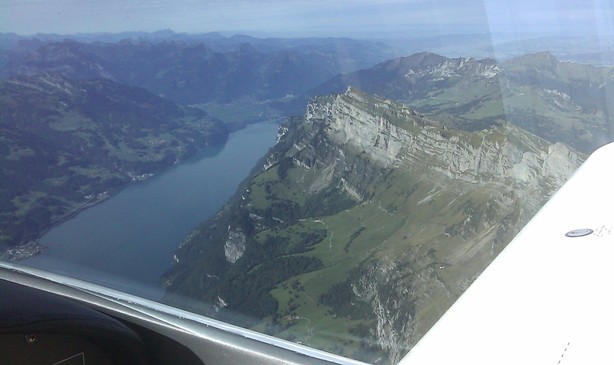
Here the Walensee, a lake that lies just behind the Churfirsten. The terrain drops more than 2’000 m from the peaks to the lake.
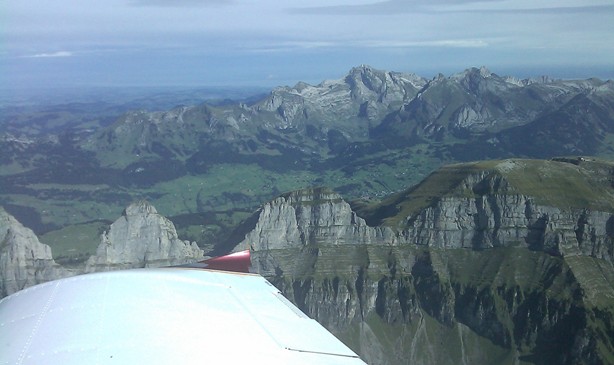
And here the peaks from the lake side, with the Säntis in the background. Most of the Churfirsten are much easier to climb that what it looks like from the south, ordinary hiking equipment is sufficient. It’s quite spectacular to sit on top and let the feed hang down towards the lake (nearly as good as flying…).
I will send the test results to the EAS tonight, after that I should receive the permission to fly to some other airports near Lommis.
The total flying hours are now:
| Flight | Flight duration | Landings | Remarks |
| 13 | 0:37 | 1 | EAS test flight 4 and 5 |
| 14 | 0:50 | 1 | |
| Total | 9:58 | 15 |
18.09.2010: Next on the list are the flights to determine landing and takeoff performance. Compared to the past, where observers on the ground were required to determine visually where the plane took off and where it reached the obstacle altitude of 15 m / 50 ft (which was more guesswork than proper measurement), these flights can today be done solely with a GPS that records the flight track in 1 second intervals. The data is then analysed and the takeoff and landing values calculated from that. The Garmin GPSMAP 695 in our panel can do that kind or recording, so the flight can be done even alone.
I got the approval to proceed with the takeoff and landing test flights yesterday, with the restriction to do them at either St. Gallen Airport or Mollis Airfield. I can’t do them in Lommis, as a hard surfaced runway is required. As the weather was fair today with hardly any wind (the flight have to be done with a maximum of 5 kts wind), I took the chance and went to St. Gallen. I phoned them before flying there to make sure that there is no problem doing the tests, as they require to stop on the runway for 10 s before taking off and 10 s after landing before vacating the runway to allow the GPS to record the starting / stopping point properly. St. Gallen has some scheduled flights and some business jet activity, but they told me it’s no problem. I could even do stop and go’s, with a stopping pause of 20 s in between, as the runway is 1800 m long.
As no flight observer was available I had to add some lead weights on the passenger seat to get to the maximum landing weight of 600 kg. I have 630 kg takeoff weight, but making tests at that weight would have meant to fly off 30 kg of fuel after each takeoff, then do one landing, then refuel and then take off again. That would have taken most of the day, as 30 kg of fuel is about 42 litres, which is more than two hours of flight, so eight hours for four takeoffs and subsequent landings, even at high power setting. I have discussed with my flight advisor to add a water tank that could be emptied after each takeoff, but we finally decided to do the tests at 600 kg. EAS requires at least 95% of the MTOW, and that’s 598.5 kg, so 600 kg should be fine.
The flight was uneventful, all went well. I did four landings and four takeoffs, but the data for one landing is not usable as the GPS did not record (my mistake). I need three usable sets of data, so let’s hope the EAS will be happy with what I have. The data has to be entered into an EXCEL spreadsheet, which does then display the vertical profile in a graph, and from what I can see the takeoff run was about 200 m and the landing run around 150 m, both without really flying aggressively. The proper values will then of course be calculated for ISA conditions and sea level by the EAS.
This flight was also the first flight with HB-YNL to another airport, and the first one to a hard surface runway. All went fine, and the runway was definitely long enough. When leaving St. Gallen after the tests the tower announced crossing traffic within the CTR boundary, a Zeppelin NT! They do regular sightseeing flights with it from Friedrichshafen over the Lake of Constance. You feel like in a film from the 30’s when passing a Zeppelin, cool. Wouldn’t that be a cool homebuilt project? The ultimate travelling machine.
The total flying hours are now:
| Flight | Flight duration | Landings | Remarks |
| 15 | 1:23 | 4 | EAS test flight 6 |
| 16 | 0:21 | 1 | flight back to Lommis |
| Total | 11:42 | 20 |
I am off again for two weeks, first for a few days to the US, then to Australia, so no flights until beginning of October.
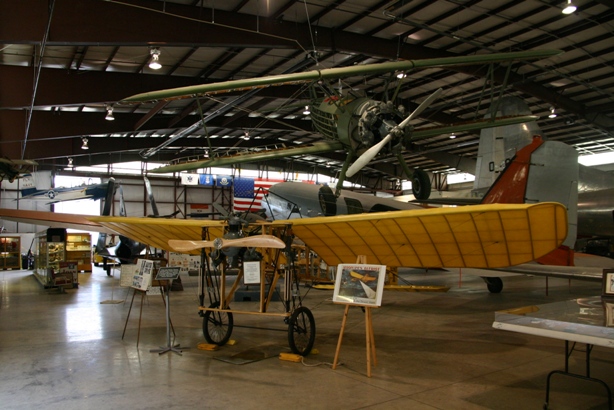
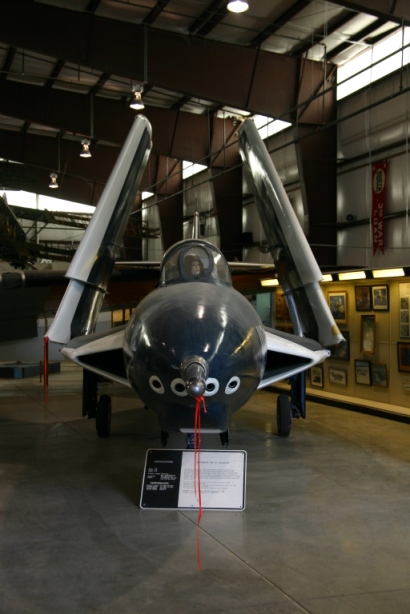
22.09.2010: I am back in the US on business. During my stop today in Pueblo, Colorado (that’s roughly where the end of the world starts) I managed to spend about half an hour visiting the local aviation museum (which was enough time). They have only a few planes, maybe 25, and only half of them can be seen as the other half is in a new building that is still under construction. Near the entrance they have a very nicely built replica of a Blériot, with an original Anzani engine. It never flew, however, as they did not manage to make the engine run…
A bit more in the back of the building I got some good ideas for improving the SportCruiser. First they had one of the first jets operating from aircraft carriers, a Grumman F9F Cougar. I liked the space saving wing folding mechanism, which could solve our hangar space problem in Lommis.
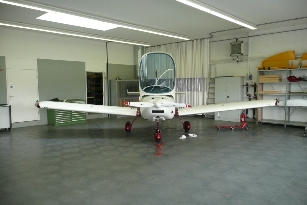
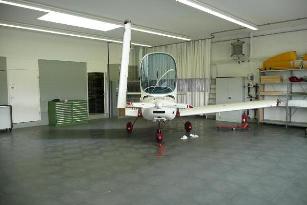
On the SportCruiser that would look something like that:
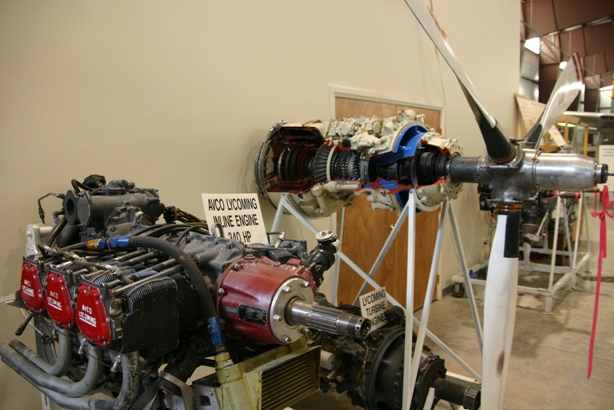
Then they had a piston engine and a propeller turbine side by side to demonstrate the performance gain possible with an engine of the same size and weight (300 hp to probably around 1000 hp)… I would finally have my vertical takeoff plane.
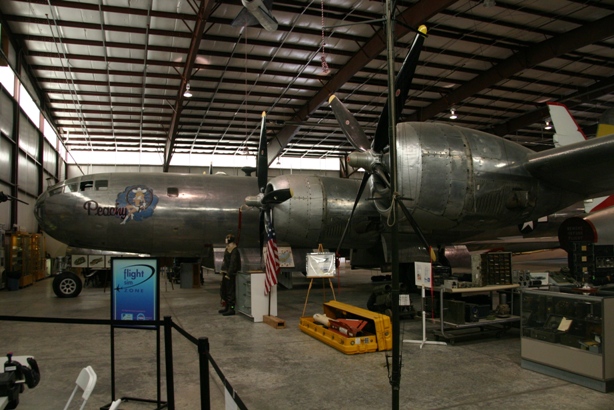
They also have a B-29, which took more or less half the space in the museum. That thing is really big.
In the meantime I have sent my takeoff and landing performance data to the EAS for verification. It took me some time to extract the right data from the GPS data streams I recorded and insert it into the Excel sheet they provide, bit the result are nice graphs for takeoff and landing as the ones shown below (no, I did not use the rocket motor to assist the takeoff):
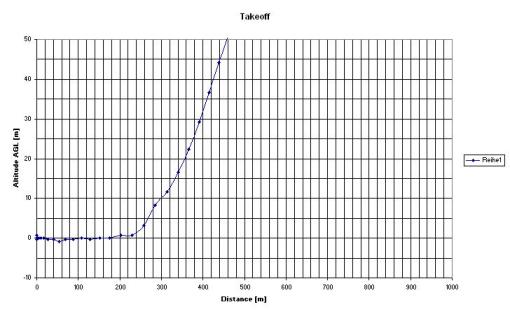
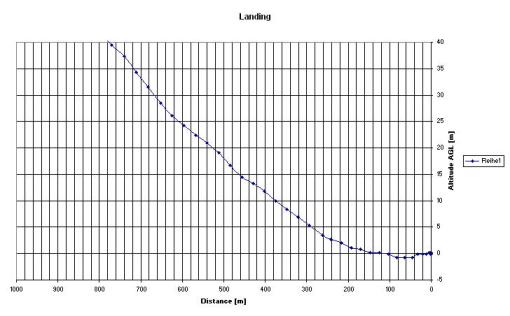
Takeoff and landing ground rolls were about 220 m, respectively 180 m, and both flown quite normally (e.g. no whistling tires during braking). Over the 15 m obstacle that gives about 350 m takeoff, respectively 450 m landing distance. These are however just the values I am reading from the graphs, they will again be corrected by the EAS to standard atmosphere and no wind (I had 4 to 5 knots headwind during all tests). The value for the landing can probably still be improved by reducing the approach speed by a few knots, and by making a power on landing, but the ones above are more than good enough to fly from the shortest strips I know of.
My web provider did some changes on his servers, so publishing the website directly out of FrontPage does not work for the moment. I therefore had to switch to using FTP, which is much less comfortable. That is also why some features, such as the access counters, won’t work for the moment. I hope to have that corrected soon, but communication is a bit difficult with them with 8 to 10 hours time shift.